The work of Edward Tufte and Graphics Press
Graphics Press LLC P.O. Box 430 Cheshire, CT 06410 800 822-2454
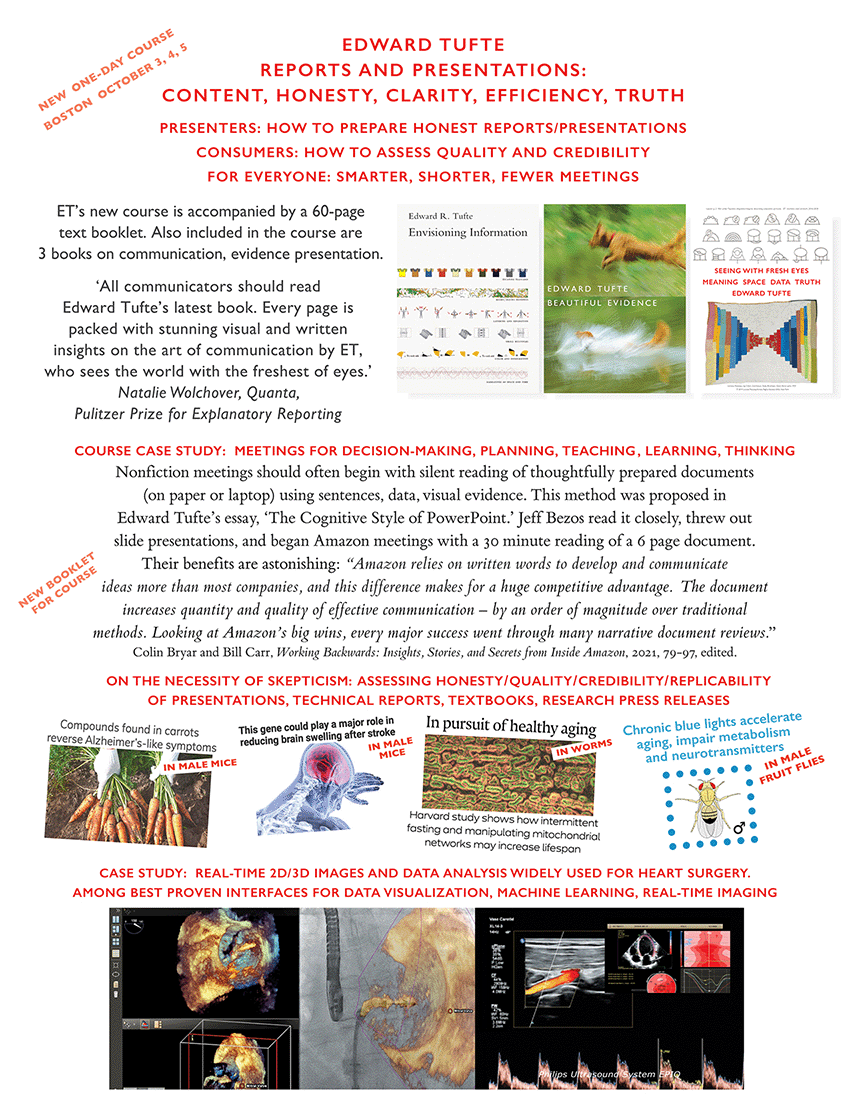
New One-Day Course
Reports and Presentations:
Content, Honesty, Clarity, Efficiency, Truth
 'Edward Tufte is the revelatory retina of our time,
ever connecting eye and brain in enlightening new ways.
He creates masterpieces about design that are themselves
masterpieces of design. Seeing with Fresh Eyes:
Meaning, Space, Data, Truth takes all that he knows into
a yet deeper level of wisdom and wider realm of inquiry.
A completely delicious work.'
Stewart Brand, creator of the Whole Earth Catalog
'Edward Tufte is the revelatory retina of our time,
ever connecting eye and brain in enlightening new ways.
He creates masterpieces about design that are themselves
masterpieces of design. Seeing with Fresh Eyes:
Meaning, Space, Data, Truth takes all that he knows into
a yet deeper level of wisdom and wider realm of inquiry.
A completely delicious work.'
Stewart Brand, creator of the Whole Earth Catalog
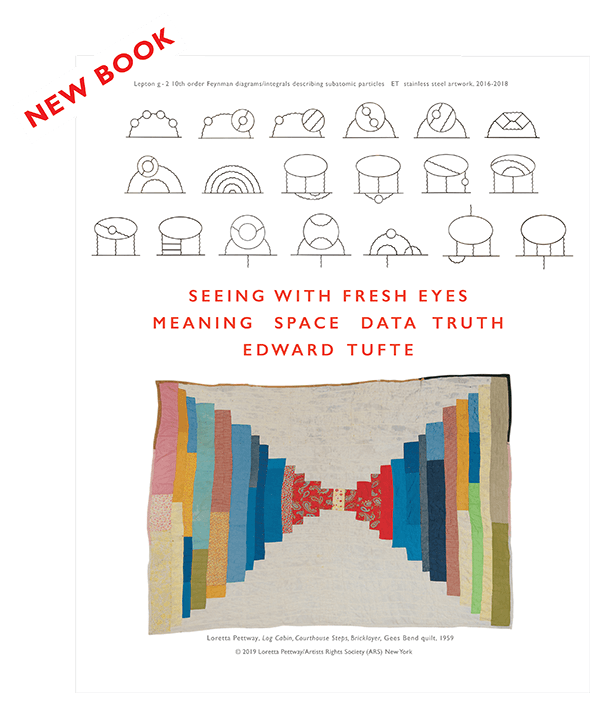
Order book now direct from Graphics Press:
Seeing with Fresh Eyes:
Meaning, Space, Data, Truth
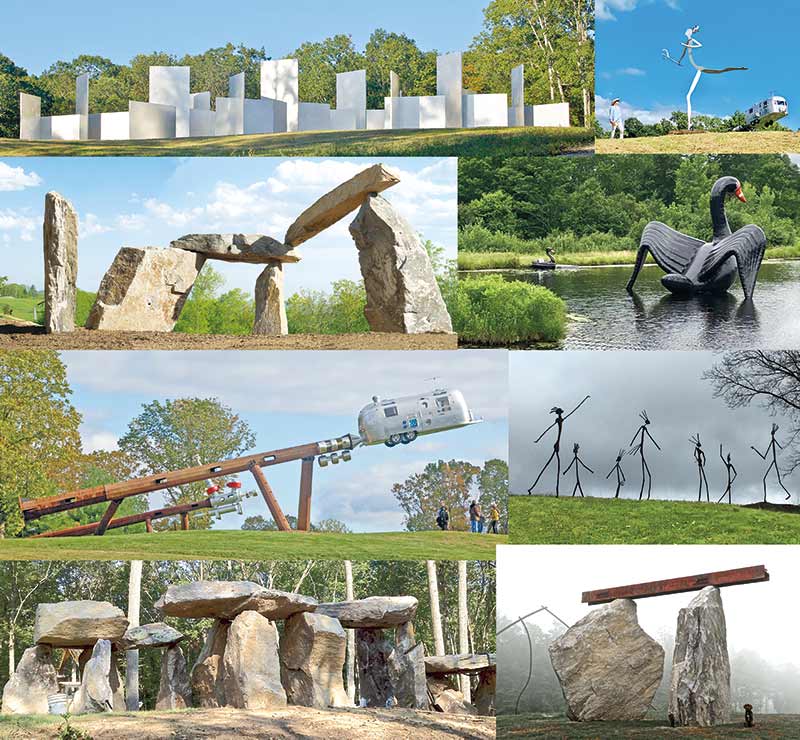
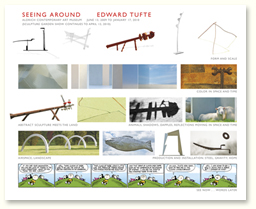
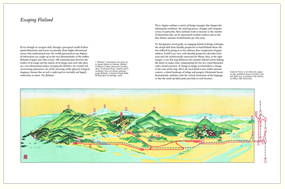
Hogpen Hill Farms: ET's Landscape Sculpture Park
Hogpen Hill Farms is a 234-acre tree farm + landscape sculpture park with 100 ET artworks in Litchfield County in northwest Connecticut.
Please click here to see dates the sculpture park is open in 2024. (Please do not come on days when the park is closed. There is no access, the gates are closed.)
"It is wild, whimsical, grand and incredibly beautiful, with sculptures ranging from stainless steel surfaces reflecting every nuance of light, to lacy stone walls and silent boulder megaliths." Michele McDonald, Boston Globe
"North America's best sculpture park: Edward Tufte's Hogpen Hill Farms" Philip Greenspun
"Each of the works transforms the landscape, see these amazing artworks up close." Atlas Obscura
Analyzing/Presenting Data/Information:
An online video course taught by Edward Tufte
The online video course is open for sign-ups.
Topics covered in this one-day online course include:
Fundamental data analysis/design strategies: diagrams, data visualizations, maps, images, text, tables, videos, small multiples, sparklines, medical interfaces, sentences and paragraphs. Future of information displays: 4K, 6K video-maps and stop-action moving in time.
Practical real examples: medicine, business and finance, NASA, medical research, science and engineering, and a 40-page chapter from Seeing with Fresh Eyes on data analysis when the truth matters.
How to make meetings smarter and shorter - teaching, very large meetings, medical appointments, hearings, small groups making decisions. How to improve both the content and credibility of presentations.
Spectatorship: How to be a smart consumer of presentations, assessing their credibility and content.
323,000 people from 1994 to 2020 attended continuously changing live versions of the ET course Presenting Data and Information. But now we have an online course video. This course can be viewed anytime, and students receive all 5 ET books in advance by mail - for study hall and reading during the course. The online video is closely keyed to the books, with short reading throughout the course.
Edward Tufte teaches the entire course.
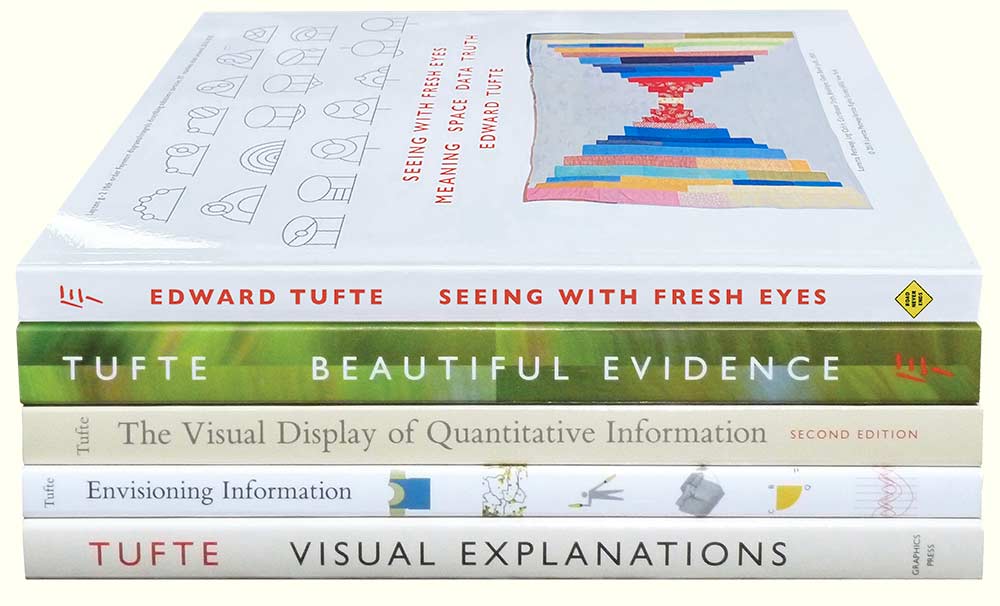
Each student receives all five ET books on information design:
"One visionary day.... the insights of this class lead to new levels of understanding both for creators and viewers of visual displays." WIRED "The Leonardo da Vinci of data." THE NEW YORK TIMES "The Galileo of graphics." BLOOMBERG
Edward Tufte is a statistician and artist, and Professor Emeritus of Political Science, Statistics, and Computer Science at Yale University. He wrote, designed, and self-published 4 classic books on data visualization. The New York Times described ET as the "Leonardo da Vinci of data," and Bloomberg as the "Galileo of graphics." He is now completing a book Meaning, Space, Models, Data, Truth, and constructing a 234-acre tree farm and sculpture park in northwest Connecticut, which will show his artworks and remain open space in perpetuity. He founded Graphics Press, ET Modern Gallery/Studio, and Hogpen Hill Farms.
$180 for all 5 catalog + shopping cart

Inge Druckrey's wonderful teaching is an inspiration.” Luke Geissbuhler,
cinematographer of Helvetica “A great story beautifully told.” Ken Carbone
An ET MODERN film, 37 minutes, all for free click above.
Produced by Edward Tufte, Directed and Edited by Andrei Severny
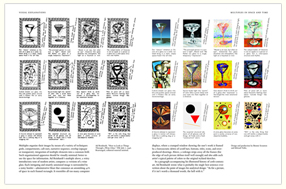
Art: ET Notebooks |
Science: ET Notebooks |
Posters, Essays, Graph Paper
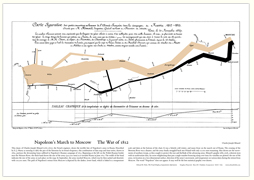
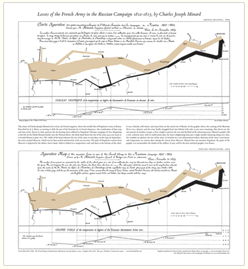
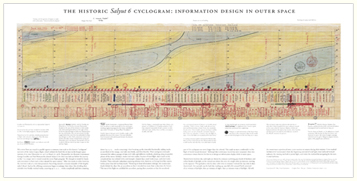

Fine Arts Prints
Graphics Press LLC P.O. Box 430 Cheshire, CT 06410 800 822-2454 or 203 272-9187 Fax 203 272-8600
All text and images at this website are copyright © by Edward R. Tufte or by original copyright holders. Material from this website may be reproduced only with the permission of the publisher, Graphics Press LLC.