Election data displays
Easily the best map (because of its notable content):
Electoral college outlook, Obama v. McCain, from 2 years ago (mid-October 2006):
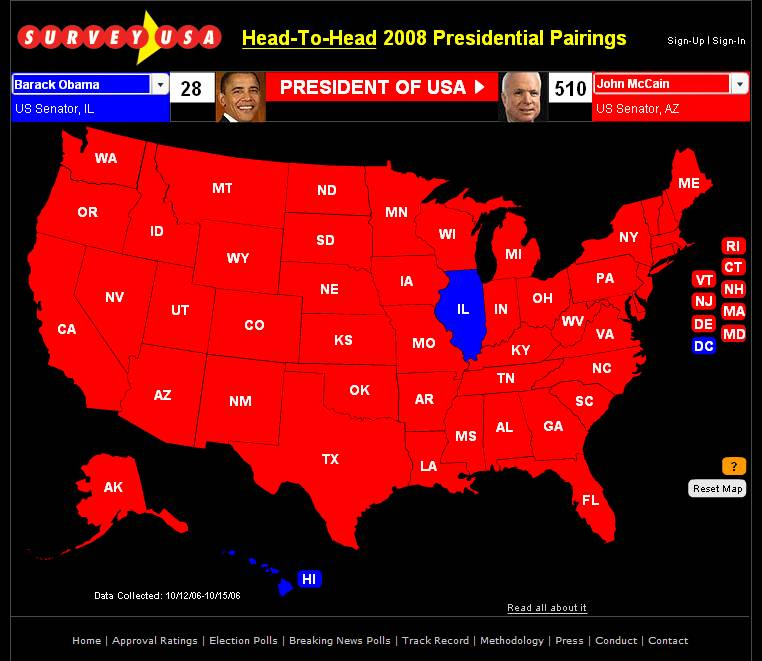
Source: SURVEY USA
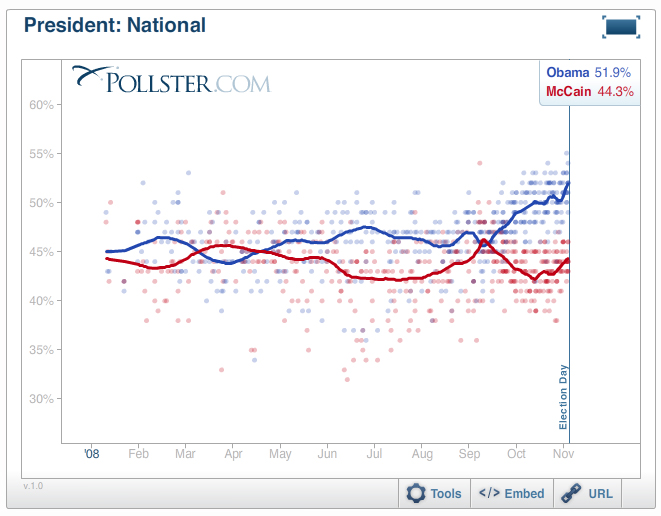
Excellent reporting of pre-election polls: Pollster.com graphics and tables. Run by first-rate
scholars of surveys, pollster.com provided individual survey results in a long-run context, which reduces the tendency for partisans and
news reporters to go crazy with every little daily random bounce. The main bias of the media is hyped news, which too rapidly
discounts olds, context, stability, and trends moving at a weekly or monthly pace.
Below, pollster.com graphics for some 550 presidential
election polls for all of 2008, along with summary smoothing lines. Particularly helpful is the visual comparison of all the polls each day on the vertical alignment. Also each new daily addition to the graphic (during the course of the campaign) locates that day in relation to all previous daily polls in the campaign. This graphic provides both overview and detail; in well-designed data displays, there does not have to be a trade-off between a quick-read overview and some detailed data showing the pieces going into the overview. Notice how the stronger colors of the smoothed path are cleanly separated from the lighter daily dots from each poll. Also interesting is the increase in the number of daily polls during 2009.
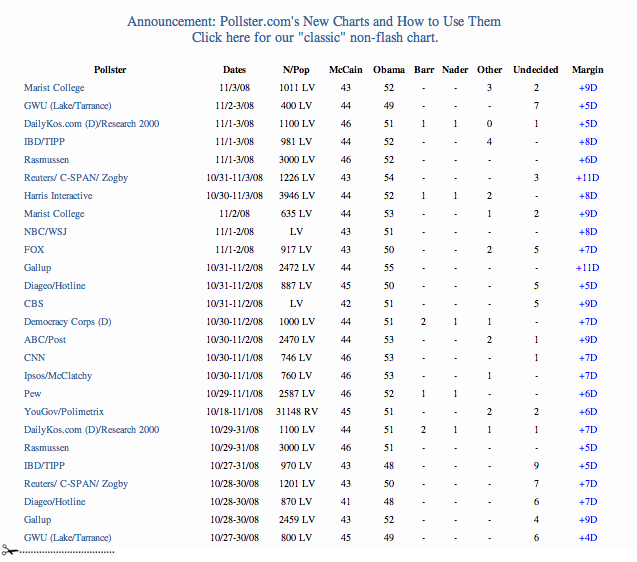
Below, here’s a part of accompanying database table, and so on through all 550 surveys:
The above graphics and tables serve well as models for reporting quantitative evidence in government and business (who might well ask “why aren’t our evidence displays up to pollster.com? And why are we still using PowerPoint templates for data presentations?”) The success of pollster.com on the internet indicates that these displays have met a market and usability test: millions of visitors have come to appreciate intense data presentations that combine both overview and detail.
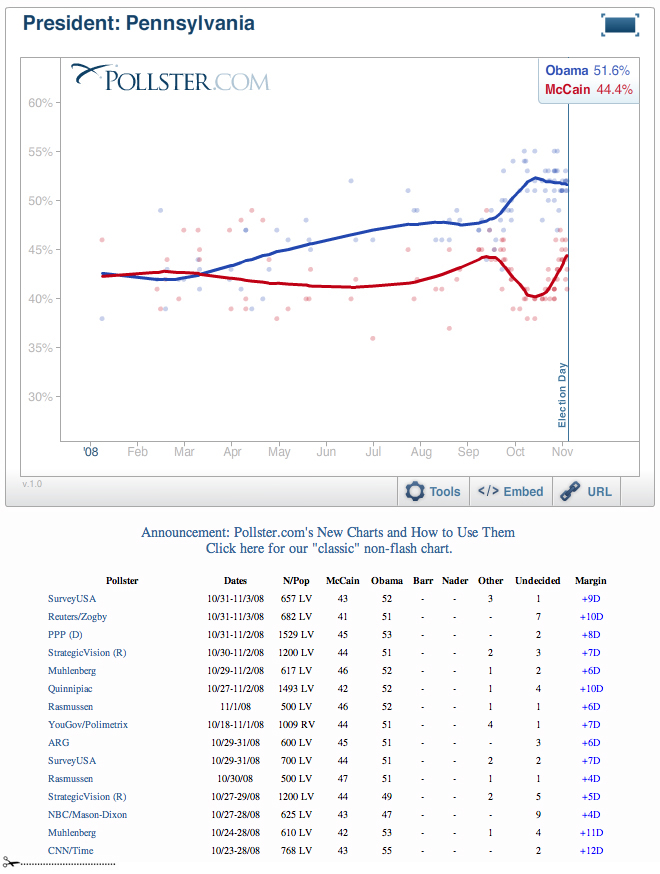
Below, pollster.com’s display for a state:
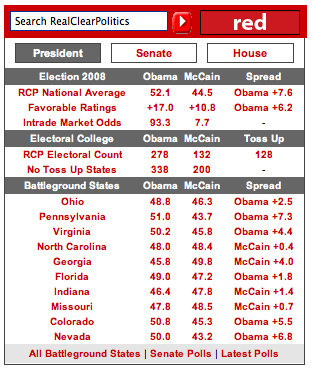
Real Clear Politics provided a well-designed summary table showing the
immediate polls, betting, and electoral college distributions. Most of the mainstream media relied on this table for polling coverage. RCP’s Jay Cost of wrote several thoughtful pieces puzzling over polling data. And pollster.com produced many
high-level and deeply informed discussions of polling methodology. My conclusion: journalists should have relied on both pollster.com and RCP.
Here are some good tables and graphics from RCP on election day:
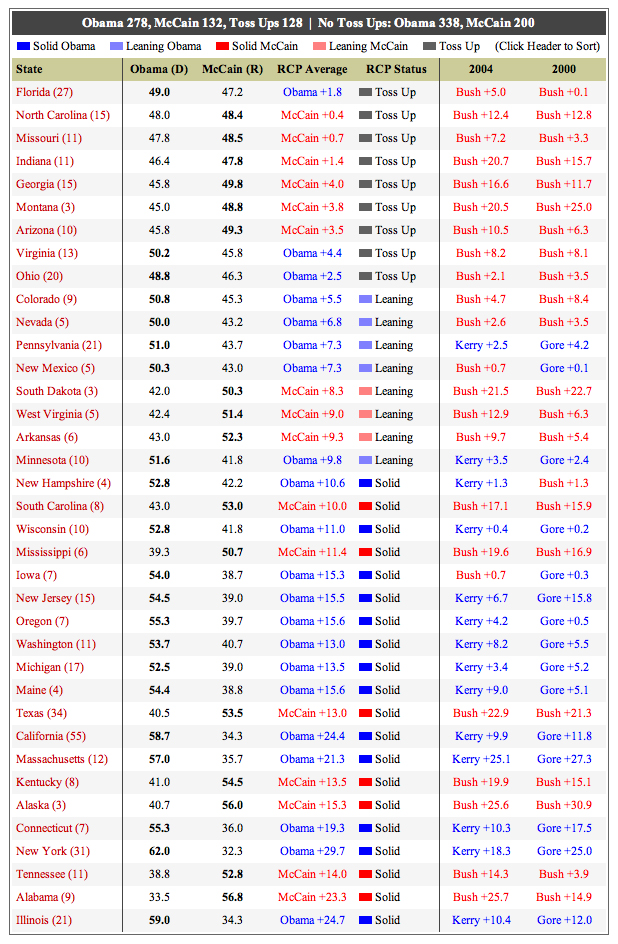
Below, a beautiful table from RCP:
Here’s RCP on Florida; note the betting data:
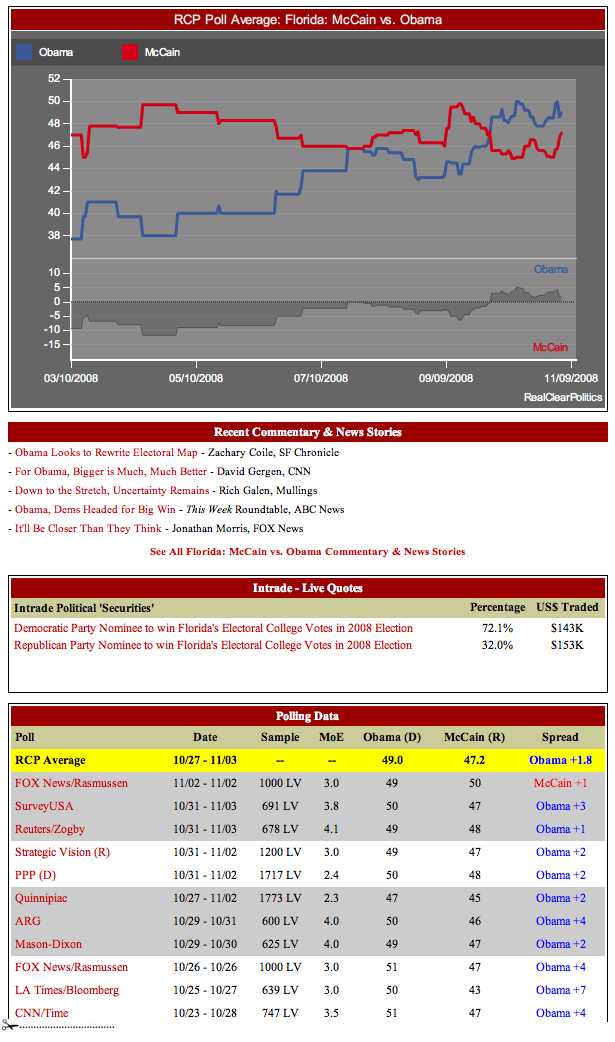
All these screen dumps were collected around 2.00pm on election day, November 4, 2008. I should have also picked up the excellent displays of fivethirtyeight.com as well.

How about the Cartograms available from
electoral-vote.com
Click on the “Cartogram” link in the middle of the page.
It’s all good: softened background, equalized areas, muted colors, nice
interface as you scroll over the map.
Here is a screenshot.
On CNN’s televised election coverage they are now using holograms to create 3D graphics illustrating the shift in power
in the Senate and the House, but it did not seem to improve the presentation of the data at all, in fact it seemed more
confusing than a more simplified two-dimensional presentation. Any thoughts on the effectiveness of these images? It
is being presented live right now, I will post an image if I can find one.
Pollster’s graphics are indeed beautiful: minimum shading to show difference, strong
trend lines to pull together all the lighter circles.
I recommend graphics from fivethirtyeight.com over RCP, especially Nate Silver’s
late-election-day charts which visually organize states on the continuum from safe-
Obama to safe-McCain.
To reproduce equalized areas in text, we could scale the state abbreviations, below the
heavy bar in Nate Silver’s table by the number of electoral votes—like font-size
differences in tag clouds. We could replace the groupings with a continuous percentage
field on the horizontal axis, and time at which the polls close on the vertical axis.
We could also replace groupings and counts on the second line, with electoral-vote-scaled
histogram bars in a sparkline over a continuous horizontal range, to present and preserve
subtleties of the original data. With this we would probably also want decile marks, or
more appropriately, red and blue marks at 270 electoral votes from each side. This would
communicate visually the weight of the electoral votes on each side, without needing to
parse and compare numbers in text.
Here is an image of the 3D hologram used to represent the Senate seats last night during the election.
The New York Times election map is a superbly interactive piece of work. I didn’t appreciate it at first, until I started double clicking at random and uncovering its affordances.
http://elections.nytimes.com/2008/results/president/map.html
Don’t miss the county leaders, which make a red/blue heat map; the county bubbles, which emphasise the high and low population areas; and the zoom in to individual states.
The Big Board, on the next tab to the left, is a sparsely elegant arrangement iof the states in columns.
Also amazing that in the maps Derek posted, you can also use the sliding scale to alter the map’s timeframe and the
scale of the county bubbles. I’m wondering how else one could apply this type of scalable proportion graphics. Are
there any other examples of this online?
This website compares maps of final election results via population weighted maps. It has thorough explanations and is worth a look.
http://www-personal.umich.edu/~mejn/election/2008/
http://www.fivethirtyeight.com was my daily status update on the horse race. They had amazing graphics and superb methodology. Their daily win-percentage estimate was actually based on monte-carlo simulations of each state. The final popular-vote prediction was remarkably accurate. Also appreciated was the daily probability of the Dems getting 60 senate seats.
[ET note added: the fivethirtyeight displays are superb. I discovered 538 about
a month before the election, and then followed the election on 538 as well as
pollster.com and RCP.]
Christian McNeil presents, using small multiples of maps of the southeast United States,
a regression from county votes, to slavery and cotton, to agricultural fields, to chalky
soil, and finally to inland shorelines of the late Cretaceous era.
The Black Belt: How Soil Types Determined the 2008 Election in the Deep South.
http://vigorousnorth.blogspot.com/2008/11/black-belt-how-soil-types-determined.html
Folks reading this thread may be interested in this large print: A Visual History of the American Presidency by a former student of Professor Tufte’s. It as a high density of information that places each presidential administration in historical context (including includes small cartograms of each presidential election).
http://www.timeplots.com/potus
I would also love feedback (send to ngp@timeplots.com) on A Visual History of the U.S. Senate, which is currently in draft form (plenty of data, color, and design improvements need) at http://www.timeplots.com/senate
This chart takes a look at voter registration, turnout, and turnout-of-registered trends across the past four presidential elections in the United States: 1996, 2000, 2004, and 2008. The data come from the Current Population Survey and are Lowess-smoothed to reduce the survey sampling variability across age.
Voter Registration and Turnout by Age in U.S. Presidential Elections, 1996-2008
The chart displays 3 behavioral outcomes over 4 elections and an average of 66 age categories, for 792 combined data points. Its clearest implication is the impact of voter registration and GOTV campaigns on increasing turnout among young voters in 2004 and 2008.
Feedback and ideas for improvement would be greatly appreciated as well.
Cantor vs Brat primary results, June 2014
¿¿¿¿¿¿56% to¿¿¿¿44% was not the result.
¿¿¿¿7.6% to¿¿6.1% was the result.
This is a classic and important case of “compared to what?” What does 56% mean? 56% of what? What does the “low” in
low voter turnout mean? Low compared to what?
Tiny minorities can run things when masses of decent people don’t vote, thus voter turnout is extremely important. That
is crystal clear when voting results are displayed truthfully. I claim that truthful percentages are votes divided by total
registered voters, not votes divided by the number who voted. The percentages I show above would be even lower if you
include people who could have registered but didn’t. (Determining that number would not be easy, I bet.)
Do we like people to be lulled into assuming that elections are won by majorities when they aren’t? Do we want
people to have no understanding of what voter turnout means? If so, then reporting
percentages as is done now is just right. But think how stunned people would be the first time they look at election
night
results on TV and see that all winning percentages are well under 50%. Could this be a shock that apathetic voters sorely
need, so we can get better government? Maybe people will even begin to fathom the benefits of ranked choice voting.
How can we get election authorities and news outlets to start reporting only true vote percentages? Or at to least get
them always to show the percentages both ways?
2014 VA district 7 primary results
2014-04 VA district 7 voter registration csv file (latest data available
at this
writing)